Select Value

WOD Architect

?
Athlete
Athlete
Performance
Custom
👤Athlete

Shown on Box Session leaderboards. 30 characters max.

30
♂ Male
💪 Intermediate
❤️ Conditioning
📐Body Metrics
175 cm
75 kg
📏 Precise Measurements (optional)
❤️Aerobic Capacity

Used to estimate the aerobic overhead of all sessions — the systemic metabolic cost beyond mechanical work. Enter either VO₂max directly or your heart rate values for an estimate.

— ml/kg/min

Leave blank to use a calculation method below.

Cooper Test
— m

12-minute run — distance covered in metres

2km Row PR
or estimate from heart rate
— bpm
— bpm
🏆Benchmark WODs
Benchmark WODs
Save a benchmark WOD workout to see your PRs here.
💪Strength PRs
1-Rep Maxes

Enter your 1RM to unlock Relative Loading — shows what % of your max you're lifting each session.

Back Squat
Deadlift
Clean & Jerk
Snatch
Strict Press
Bench Press
🏃Cardio PRs

Required to calculate Aerobic Metabolic Cost for running, rowing and other cardio movements. Without these, only mechanical energy is shown.

Run 400m
Run 5km
Row 500m split
Row 2000m
Ski Erg 500m
Bike (cal/min)
Double Under/min
⚙️Custom Movements

Define movements not in the built-in library. Each custom movement is based on an existing movement's physics values.

🎯Box Scaling

Customise scaling substitutions for box sessions. Search any movement to configure its Scaled and Foundations variants.

75%
50%
Add a block to see the overview...
Block 1
Movements
Templates Saved WODs
📋 Today's Workout
No blocks added yet.
00:00
READY
Swipe to Finish Block
0
Save at least 1 workout to see training load.
"unit">Intensity 0

Watts / kg — power relative to mass.

"unit">Total Work 0

kJ — total mechanical work done.

"unit">Total Metabolic Cost 0

kcal — mechanical + aerobic energy.

"unit">Force Bias 0

Tonnage ÷ work (kJ). High = strength dominant. Low = conditioning dominant.

"unit">Actual Technical Demand

Skill complexity 1–5 based on reps completed.

📖 Understanding your results
Intensity (W/kg)
Power output relative to your bodyweight. Calculated as total mechanical work divided by session duration and mass. High = short intense session. Low = long aerobic session. Compare across sessions over time to track fitness gains.
Total Work (kJ)
Total mechanical work divided by session duration. Measures how much volume you packed into each minute. Useful for comparing workouts of different lengths — a short Grace can have higher work density than a long Murph.
Metabolic Cost (kcal)
Estimated calories burned, derived from total mechanical work using a 22% mechanical efficiency factor — the same model used in exercise physiology research. Useful for energy expenditure tracking and nutrition planning.
Force Bias
Measures stimulus type, not difficulty. Total barbell tonnage divided by mechanical work. High = strength or barbell dominant. Low = conditioning or bodyweight dominant.
Relative Loading
How heavy the barbell work was relative to your personal maxes. Two athletes doing the same weight experience very different sessions if their 1RMs differ. 50–70% = conditioning zone. 70–85% = strength-endurance. 85%+ = near-maximal. Requires 1RM data in your Profile.
Actual Technical Demand (1–5)
Rep-weighted average skill complexity across all movements you completed. 1 = basic bodyweight movements. 5 = elite Olympic lifts. High scores require full concentration — avoid technically complex sessions when heavily fatigued or sleep-deprived.
Calculation Audit Trail
💡

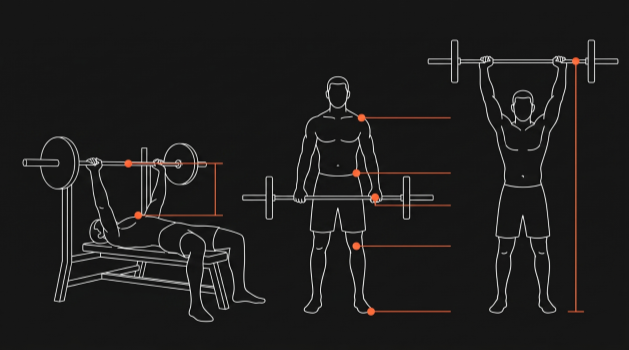
Energy Systems show fuel source based on duration & intensity (Phosphagen / Glycolytic / Aerobic). Movement Bias shows primary physical demand (Strength / Power / Metabolic / Endurance). A workout can have mixed energy systems but lean 100% toward one bias.

🔋 Energy Systems

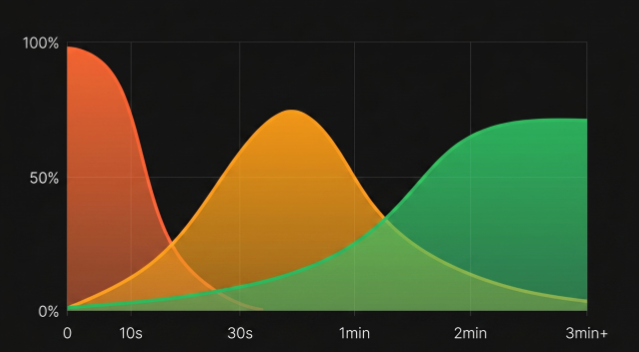
How the body fueled this session · Tap to learn more

🔋 Energy Systems — Deep Dive

Tap to flip back

⚡ PHOSPHAGEN — 0 to 10s
Fuels maximal explosive efforts — heavy barbell lifts, sprints, box jumps. Uses stored ATP-PC in the muscle. Fully recovered in 3–5 minutes of rest. High phosphagen % means the session needs long inter-set rest to be effective.
🔥 GLYCOLYTIC — 10s to 2 min
The CrossFit engine. Fuels medium-intensity repeated efforts — kettlebells, gymnastics, cycling. Burns glucose and produces lactate. Recover in 30–90 seconds. High glycolytic % builds classic metabolic conditioning capacity.
🌬️ AEROBIC — 2 min and beyond
Sustained effort — running, rowing, ski erg. Burns fat and glucose with oxygen. Most efficient system. Recover in 24–48 hours. High aerobic % builds base fitness and long WOD capacity.
🎯 Movement Bias

Primary physical demand of the movements · Tap to learn more

🎯 Movement Bias — Deep Dive

Tap to flip back

💪 STRENGTH — maximal force
Deadlifts, squats, presses. Builds structural strength and bone density. Recovery 48–72h. Consistent strength bias over weeks drives 1RM gains.
⚡ POWER — force × velocity
Cleans, snatches, box jumps. Trains the CNS to fire faster. The most sport-transferable quality. Best trained first in session when the nervous system is fresh.
🔄 METABOLIC — work capacity
Burpees, double unders, cyclical work. Builds lactate tolerance and cardiovascular efficiency. Improves recovery speed across all other training types.
🌬️ ENDURANCE — sustained output
Runs, rows, sustained cardio. The aerobic base that supports all other training. Aim for at least 1 session per week for balanced programming.
💡

Save at least 2 workouts to unlock charts.

Plan Training
Projected Training Load
⚙️ Filter & Sort
Sort by
Date Range
All
7 days
30 days
3 months
Intensity
Any
Low
Moderate
High
Total Work
Any
Light
Moderate
Heavy
Metabolic Cost
Any
Light
Moderate
High
Force Bias
Any
Metabolic
Mixed
Strength
Max Str.
Technical Demand
Any
Basic <2
Moderate
Advanced >3
Relative Loading
Any
Light <40%
Moderate
Heavy >65%
RPE
Any
Easy 1–4
Mod 5–7
Hard 8–10
How did that feel?
Rate of Perceived Exertion — used to personalise your training load.
5
Moderate
12345 678910